The Local Deprivation Explorer: Making deprivation data easier to find, understand and use

The Indices of Multiple Deprivation (IMD) rank over 33,000 small areas across the country by levels of deprivation. It’s one of the department’s most important and widely used datasets and Accredited Official Statistics – shaping policy, guiding funding and informing decisions from a wide range of users. It even influences individuals’ decisions, for example when they’re deciding where to live.
Our goal was simple – to make this data, and the insights it holds, more accessible than ever. We set out to make it easier for everyone to find, use and understand deprivation data through our dedicated site.
What we built
After reviewing user needs, feedback from previous releases and input from stakeholders, we began shaping our designs. Through iteration and testing, we arrived at 3 core elements that would define the experience.
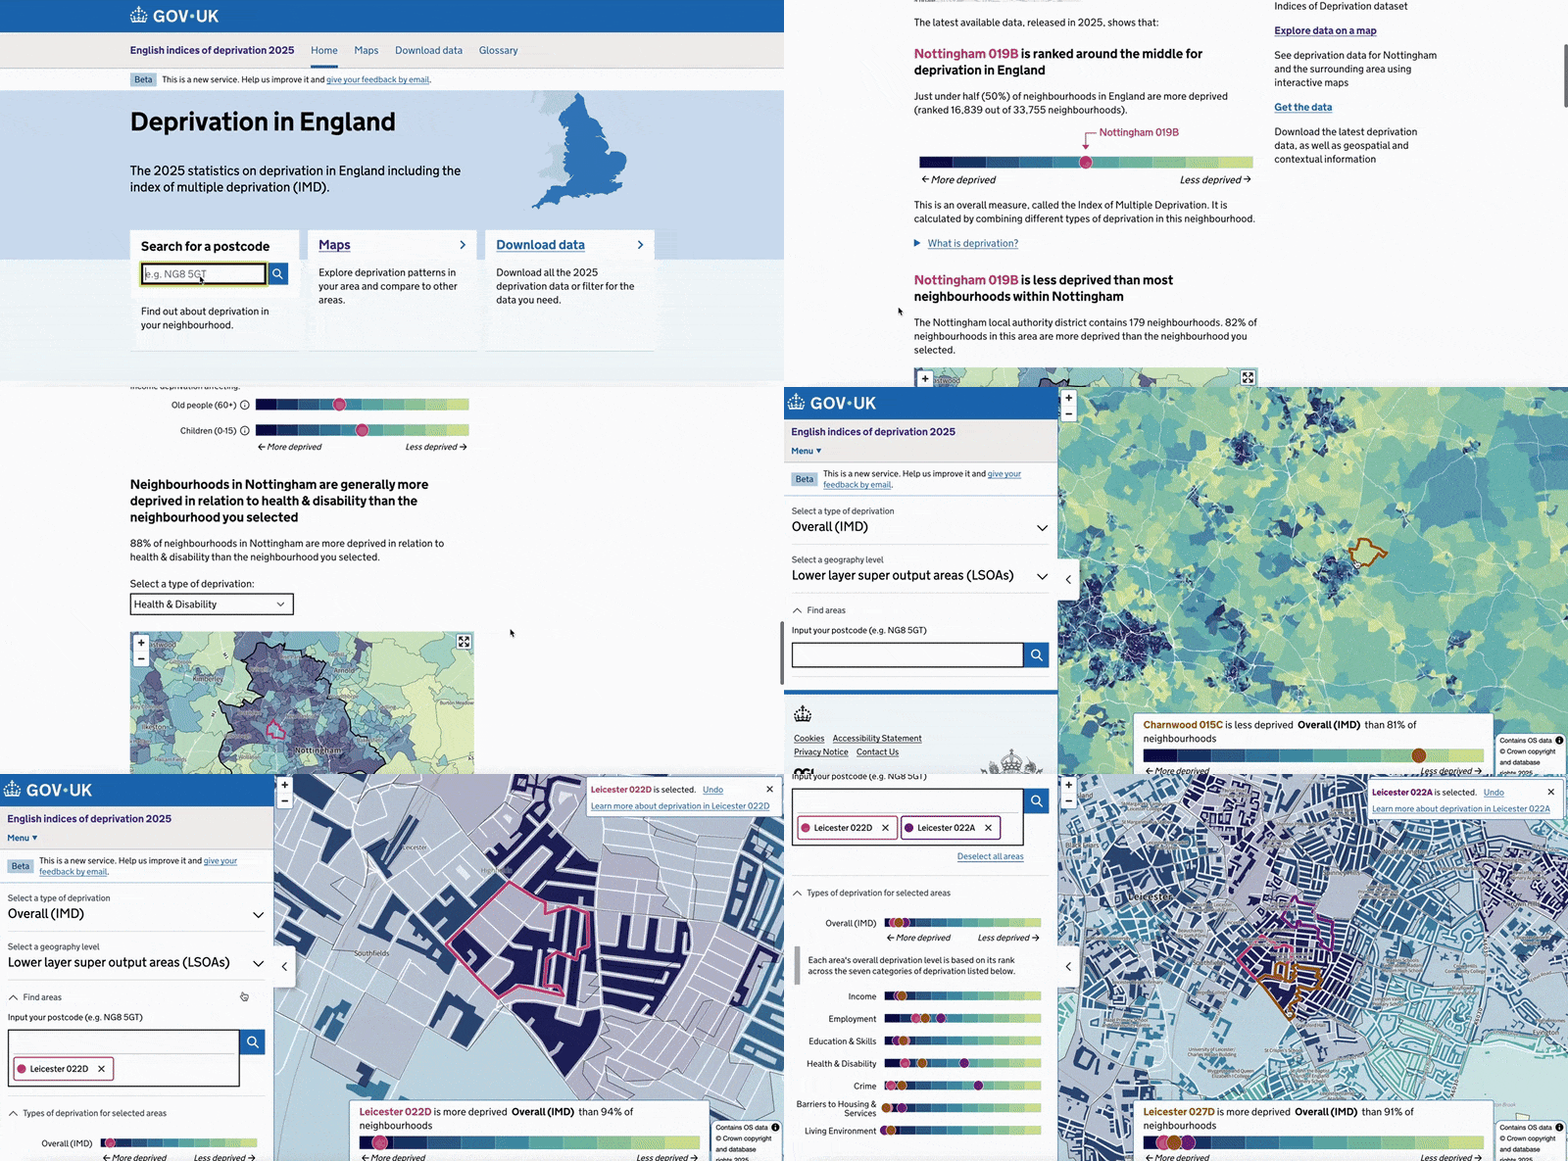
Area summaries. We know that not everyone is familiar with deprivation indices, so after a simple postcode search on the site, users are taken to a page all about their neighbourhood. We developed algorithms that translate the data into straightforward descriptions, supported by charts and maps, to help users understand what’s driving deprivation in a given area – whether it's crime, income, or other factors. Interactive maps. To support exploration, we built maps that let users view spatial patterns across the country and to zoom right in on specific neighbourhoods. Users can select multiple areas to compare and quantify differences – useful for planning services or understanding local contexts. Flexible download options. Research showed that many users just want to get their hands on the data – but needs varied. Some want the full dataset, others prefer specific extracts. So, we’ve created something that lets people get what suits their needs – whether it’s data about a specific set of postcodes, a local authority area, a specific domain of deprivation, or all of them. A quick demo of the explorer showing how users can enter a postcode and explore deprivation patterns in an area.
We strived to make everything feel connected – an intuitive flow from one part of the site to the next. For example, if someone picks an area on the map, they’re then prompted to check out the summary for that spot. Our aim was to guide users, without making them think too hard.
Designed to support democracy
It’s early days, but we’ve already begun to see the tool used in real-world settings, supporting democracy, debate and decision making, and hearing lots of anecdotes of how the service is being used. The tool is being adopted by a diverse range of users from local authorities, policymakers and community groups to researchers and the media using the insights to enhance their work or spark discussions in public forums.
Performant and reusable tech
This project marked a technical milestone for our team and the department, being the first time our Svelte component library powered a live project. You can read more detailed thinking about this in our blog post, but as a quick recap it means:
Server-side rendering, strong performance, excellent search engine optimisation (SEO): SvelteKit makes it easy for us to efficiently server-side render the many pages (one for each of the 33,755 neighbourhoods), meaning they’re quicker to load, more accessible, and can be more easily indexed by search engines. This approach allows us to avoid common pitfalls with large data-driven apps, such as slow calls to servers, heavy client-side number crunching (for example, based on the user's inputted postcode) and dynamic content which is difficult to index. The SEO benefits mean this content gets higher visibility in Google searches, helping more users get to the insights more quickly.
Built-in reactivity: Svelte allows us to easily manage users' selections – it helps us serve personalised and localised content without repeatedly asking for selections, or without needing to write lots of complex code to save and track those selections.
High levels of customisation: By building the component library from the ground up we have full control over the experience. This allows us to react to small user interaction improvements as a result of user feedback, and better meet accessibility requirements. These can be challenging to meet when working with dynamic and visual content.
Beyond the Svelte component library, we’ve also been working hard to set up shared infrastructure to host this IMD project. Importantly, this is also reusable and is already being incorporated to support future projects.
All of this means that, as a team and a department, we now have lots of the building blocks in place to deliver these types of projects and services more efficiently and effectively than ever before. So, from now on, users can expect faster, better and easier-to-access insights!
We’d love your feedback
This is all work in progress, and we’re keen to keep improving. If you’ve used the deprivation app, we’d love to hear what you think. Feedback, ideas, bug reports – all welcome.
If you’re curious about the tech behind it, want to reuse parts of it, or fancy collaborating on the component library, we’d love that too. Drop us a line at
If you’re interested in the full statistical release, it’s available online: English indices of deprivation 2025 - GOV.UK .
The brilliant multi-disciplinary team behind this work includes: Andrew Hillman, Camilla Jones, Duncan Bradley, Glenn Herbert, Hayley Swain, Ibrahim Haizel, Miles Hinchliffe, Mike Lister, Navneet Dalton and Tim Kershaw.
When you subscribe to the blog, we will send you an e-mail when there are new updates on the site so you wouldn't miss them.

Comments